As with the previous three Digital Tools Assignments, your task is to demonstrate your mastery of social network analysis using Cytoscape. This assignment has six discrete parts.
Overview of Steps:
- Formulating a research question that can be investigated by creating an edge list and network graph.
- Generating and organizing your data in a Google Sheet.
- Clean your data using OpenRefine.
- Generating a network visualization using Cytoscape.
- Change the layout and style of your network to suit the information you are representing.
- Reflecting on your process and analyzing your results in a blog post (4-5 paragraphs).
Before you begin, review Miriam Posner’s Cytoscape glossary, which defines key terms that you will encounter as you navigate the platform.
Step 1: Formulating a Research Question and Structuring Your Data
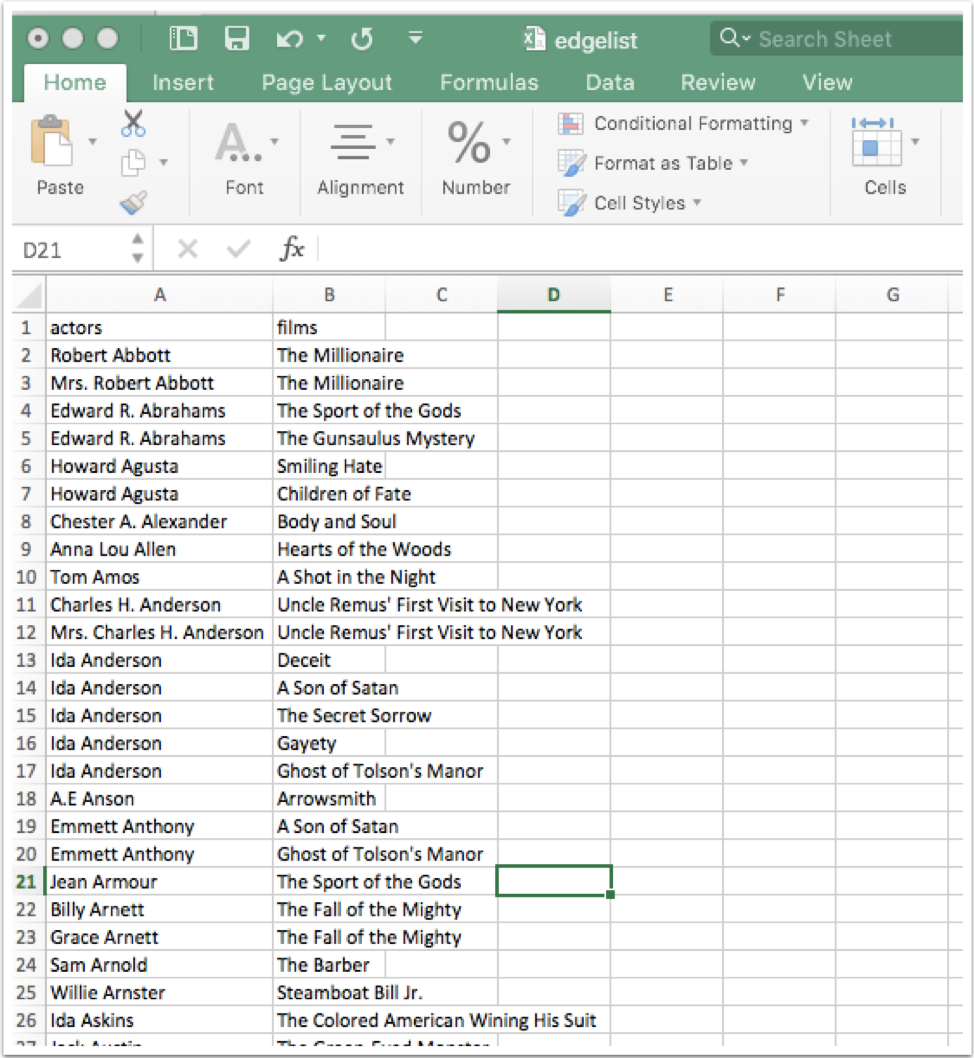
The most important thing to understand about Cytoscape is that you need to structure your data in two-column format, called an “edge list.” Column A and Column B should indicate a consistent relationship (for example, in the image below, the actors listed in Column A appear in the films listed in Column B). Below, you will notice that Option B walks you through performing the assignment using data related to films and actors, but you may use any two-column format you wish for this assignment.
Option A: Create an edge list and network graph based on a consistent relationship between any two entities that you believe are connected in a meaningful way. Be sure to specify the relationship you are exploring in your write-up.
Option B: The above screenshot of an edge list shows how to structure data for a visualization showing the connectedness between actors and films from the silent era of American race film. Select another genre or era of film and create an Edge list and network graph on the basis of this model.
Step 2: Importing Your Data
- After you create your edge list, clean your data using OpenRefine and import your data into Cytoscape.
- Remember to specify Sources and Targets, and to tell Cytoscape to analyze the network (it won’t do it automatically!).
- Lastly, play around with layout and style (color, size, border width, etc.) and choose a layout that best tells a narrative about the relationship you are exploring.
- Embed your network analysis graphic into your blog post by saving the image to your personal GitHub repository. Also be sure to include a link to your Google Sheet with your original data set.
Step 3: Explain Yourself
- How did you go about formulating a research question?
- Which nodes or edges of the network seem most significant for your research topic?
- What narrative does your network express?
- Does anything surprise you about the network?
Step 4: Submission
Once again, you’re going to submit your post in a new branch in our class repository that you will creat and name: yourname-cytoscape. Finish by submitting a pull request to the _master branch of our class repository.