Time network of letters
data set (note that Sender column was used for source node, Recipient column for target node, and Date column for edge attribute, while the other two columns were not included)
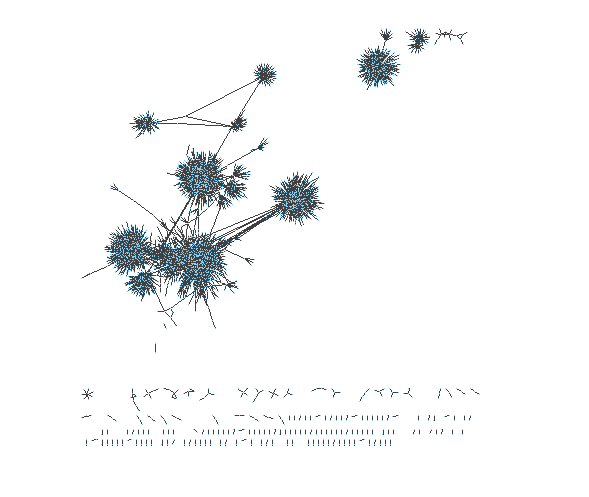
For each of three time periods (1500-1650, 1650-1800, and 1800-2000), I will show a view of the entire network as well as a closer view of a particularly interesting section of the network.
All of these network pictures show a lot of data, so they are naturally a bit cluttered and it is hard to pick out individual connections. However, this does not mean they do not show qualitatively significant network features. Two such features that are worth looking at are:
- The connections or lack thereof between components of the network, which can be observed from the broad view for each time period’s network.
- The connections or lack thereof between nodes (in particular those that are connected to a ‘hub’ node with a large number of adjacent edges) with few adjacent edges, which can be observed from the closer view for each time period’s network.
Broad view of letter network including letters from 1500-1650

Close up view of letter network including letters from 1500-1650

Broad view of letter network including letters from 1650-1800

Close up view of letter network including letters from 1650-1800

Broad view of letter network including letters from 1800-2000

Close up view of letter network including letters from 1800-2000

How did you go about formulating a research question?
The first step for formulating a research question for me was to find data suitable to network analysis. So since we read about the republic of letters and discussed it in class, this network of letter sending/receiving stood out to me as a good candidate for research on using Cytoscape. Specifically, the site we looked at in class kept metadata on the origin and destination of the letters such that each letter could be easily translated into connections between location nodes in a social network.
Unfortunately, I couldn’t figure out any easy way to scrape data from EMLO. Instead, I ended up using data from “correspSearch”, which is an online database of the metadata of scholarly editions of letters. The site seemed to be German with metadata collected from primarily german websites/databases, which might represent a skew towards more letters with origin or destination in Germany. (However, the data from EMLO – or any source – would also be skewed just in a different way, since there is always selection bias when the data isn’t 100% complete).
Once I had figured out the data that I was using (letter metadata) and the form of the network (locations as nodes, letters as connections), I began to consider what research questions could be asked about this network. Some questions were implausible given the limitations of the data (for example, any question about how the letter’s theme/type related to any other variable – time, origin, etc. – was implausible since there was no theme/type metadata). Consequently, I focused on research questions that related to the metadata that was available.
Specifically, there was metadata on the origin, destination, sender, receiver, and date of each letter. The date stood out to me as a particularly useful piece of information for network analysis since the connections were spread over a large time period. Especially in the context of this class, where we have been looking at the evolution of communication over time, comparing letter networks at different points in time seemed like a very interesting topic.
The specific research questions that I came up with in order to compare letter networks at different points in time was:
How did the distribution of letter writing change (or not change) over time?
- Perhaps as letter writing became less upper class and more widely accessible, there were letters sent from a wider variety of people
- Could look at the total number of different people who sent/received letters, but this would be very unreliable due to selection bias (More letters being sent during a given time period doesn’t necessarily mean more letters will be in the correspSearch database during that time period).
- While the above issue can’t be totally resolved, better measures include:
- Proportion of nodes with a large (or small) edgecount
- Centrality of the network
Which nodes or edges of the network seem most significant for your research topic?
I’m not sure that this applies all that well the my network and research topic since the research question is about broad trends/patterns that can’t be observed by looking at just a few nodes or edges.
One could perhaps consider the nodes with the highest edgecounts to be most significant to my research topic, but the importance of these nodes comes from how they fit into the network as a whole (are there many interconnected nodes with high edgecounts? do the nodes connected to these high edgecount nodes have high edgecounts themselves? etc. )
What narrative does your network express and does anything surprise you about the network?
I was surprised by how similar the networks were during the three different time periods. In all cases, the networks were very centralized, with a few high-edgecount nodes acting like hubs connecting a large numbers of low-edgecount nodes. In fact, the degree to which the networks were centralized this way was itself very surprising, with ridiculously few edges between low-edgecount nodes.
I would guess that the cause of the similarities between the networks and their high degree of centralization is not the nature of letter giving/receiving during these time periods, but rather the nature of the data samples collected by correspSearch. In particular, it seems likely that data samples collected by correspSearch were from databases that focused on just a few prominent figures (which would be the ‘hubs’ seen in my network) and consequently didn’t contain information about letters between that figure’s correspondents (low-edgecount nodes connected to the given hub) even if such letters did exist.
Another possibility is that since correspSearch focused on academic letters, some of these hubs may have represented editors for academic journals. Similar to databases focusing on prominent figures, some databases may have been looking at just a few journals and restricted the letters they catalogued in the same way (only looking at letters where the journal’s editor is a sender or recipient).
With the above qualitative description as well as caveats to our analysis in mind, we can also take a quantitative look at our networks:
For the 1500-1650 network, we have 1709 total nodes, with only 56 Nodes with degree > 2, and a network centralization of 0.630.
For the 1650-1800 network, we have 587 total nodes, with only 63 Nodes with degree > 2, and a network centralization of 0.214.
For the 1800-2000 network, we have 3706 total nodes, with only 246 Nodes with degree > 2, and a network centralization of 0.186.
This data supports the narrative that letter sending/receiving networks have over time become less centralized. This could be the result of wider accessibility of letter writing/sending, but it is hard to conclude this definitively given the sampling bias in the data we are looking at.

